
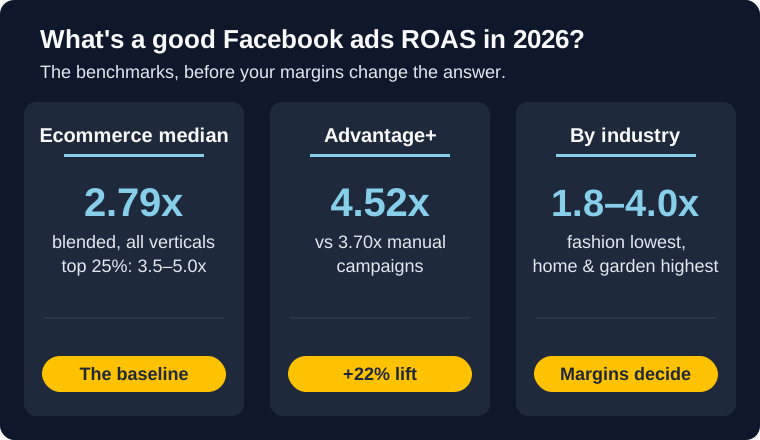
Your account is running at 2.2x and someone has told you 3x is the floor. Before you cut that campaign, check where the 3x came from.
The largest dataset that publishes its sample size covers roughly 35,000 ecommerce brands across all of 2025. Its platform-wide median is 1.86x (Triple Whale). Most pages quoting 3x and above never say how many accounts they measured.
That gap decides whether you scale, hold, or cut. This guide reconciles six published datasets, gives you vertical medians with their sample sizes attached, corrects the prospecting and retargeting ranges most guides get wrong, and walks the breakeven math that overrides every benchmark here.
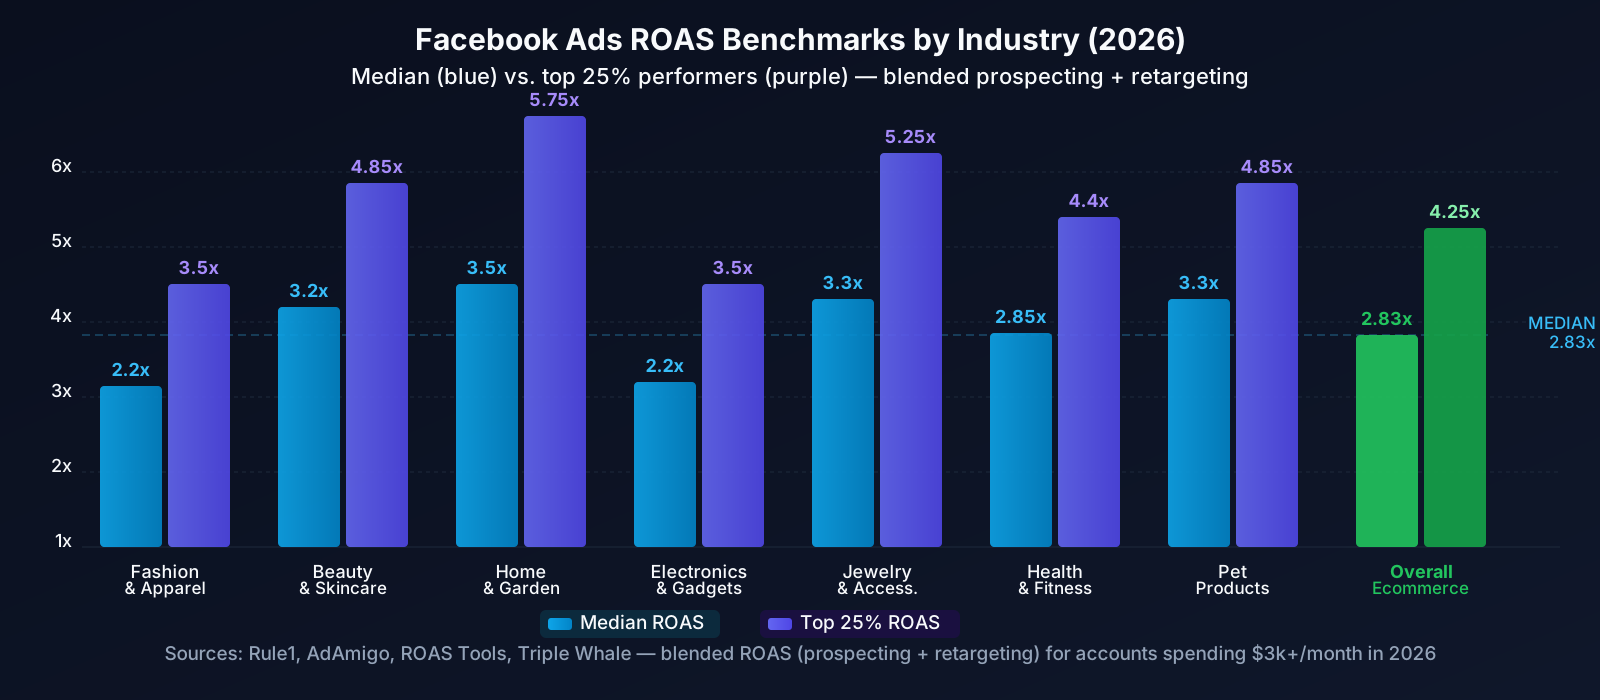
Bottom line
- Platform-wide Meta ROAS: 1.86x median across ~35,000 ecommerce brands in 2025. Published figures elsewhere run to 3.71x.
- The spread tracks sample disclosure: Every source above 2.5x declines to publish how many accounts it measured.
- Advantage+ Shopping: 4.52x versus 3.70x for manual campaigns, a 22% lift.
- Prospecting vs retargeting: Retargeting medians 3.61x, prospecting 2.11x. Retargeting runs 71% above prospecting, not double or triple.
- Your breakeven ROAS: Calculate with 1 ÷ (1 − COGS% − OpEx% − Profit%). Everything above that number is profit.
- Ecommerce CPMs are up 20% YoY: $11.82 to $14.19. Rising costs compress ROAS unless creative or conversion rate improves.
What Is ROAS? (Quick Refresher)
ROAS = Revenue from ads ÷ Ad spend. Spend $1,000 on Facebook ads, generate $3,000 in sales, and your ROAS is 3.0x. Simple math, but it's deceptive. ROAS tells you efficiency, not profitability. Two brands can both hit 3x ROAS and end up in completely different financial positions.
The difference is margins.
- Brand A: 70% gross margin, 3x ROAS. For every $1,000 in ad spend they generate $3,000 in revenue, keep $2,100 in gross profit, and pocket ~$1,100 after ad costs. Healthy.
- Brand B: 30% gross margin, 3x ROAS. Same $3,000 revenue, but only $900 in gross profit, which doesn't cover the $1,000 ad spend. They're losing $100 on every dollar they spend.
This is why your breakeven ROAS matters more than any industry benchmark. We'll walk through the calculation below.
ROI = (Revenue − Ad Spend) ÷ Ad Spend. It subtracts your cost. ROAS doesn't. A 3x ROAS equals a 200% ROI. Meta Ads Manager reports ROAS, so that's what most media buyers use day-to-day. Just remember to convert it to actual profit using your margins before making scaling decisions.
Why Every Source Gives You a Different Number
Search "good ROAS for Facebook ads" and you get answers between 1.86x and 3.71x. That's a 2x spread on the same metric, same platform, roughly the same period. Before you benchmark against any of them, it's worth knowing which is which.
Here are six published figures with their stated sample sizes:
| Source | Reported Meta ROAS | Disclosed sample |
|---|---|---|
| Triple Whale | 1.86x | ~35,000 ecommerce brands, Jan to Dec 2025 |
| Focus Digital | 2.19x | 5,000+ companies, April 2025 |
| Varos, via Superscale | 2.19x | 28 industries, April 2025 |
| InsightIQ | 2.5x | Not published |
| AdAmigo | 2.79x | Not published |
| DigitalApplied | 3.71x | Not published |
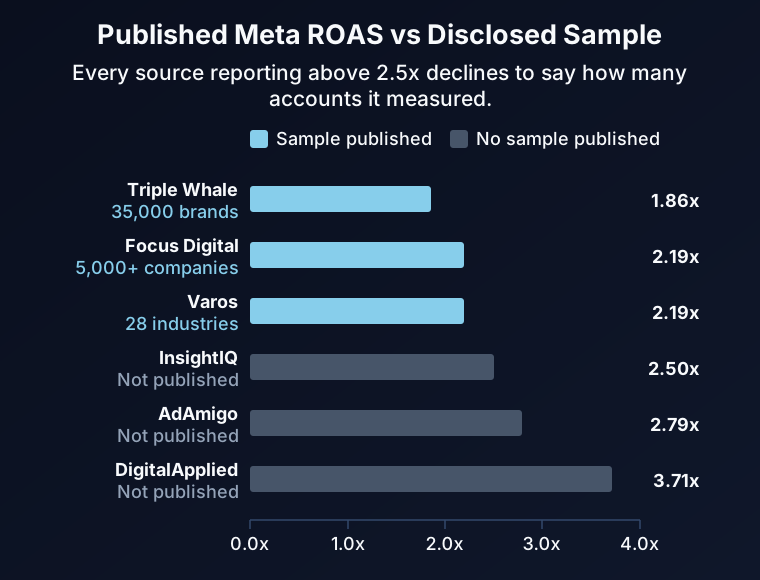
The pattern runs one direction. The three sources that publish a sample size land between 1.86x and 2.19x. The three that don't land between 2.5x and 3.71x.
Some of the spread is legitimate. A 7-day-click account reports higher ROAS than a 1-day-click account on identical performance. Datasets mixing finance, B2B, and lead gen into ecommerce move the median. A window covering Black Friday reads higher than a full calendar year, and some datasets count gross revenue before refunds.
The rest of the spread is selection. A roundup with no disclosed sample can quote whatever figure it likes.
This guide uses Triple Whale's 1.86x as the anchor, because ~35,000 brands over a full calendar year is the largest disclosed sample available and a full year washes out seasonality. Where other datasets corroborate or contradict it, that's noted inline.
ROAS Benchmarks by Industry (2025 Data)
These are Meta ROAS medians across roughly 35,000 ecommerce brands for the full 2025 calendar year (Triple Whale), with year-over-year movement.
A note on the year: This is 2025 data. Every "2026 benchmark" page you'll find, this one included, is reporting on the most recent complete year. Anyone publishing a full-year 2026 median in August 2026 is estimating.
| Industry | Median ROAS | YoY |
|---|---|---|
| Automotive | 2.54x | +1.66% |
| Sports & Outdoors | 2.28x | +3.77% |
| Travel Accessories & Luggage | 2.25x | −0.81% |
| Apparel & Accessories | 2.18x | +3.90% |
| Home & Garden | 2.18x | +7.04% |
| Baby | 2.17x | +1.63% |
| Toys, Art & Collectibles | 1.93x | +2.70% |
| Lifestyle & Boutique | 1.93x | +2.70% |
| Electronics | 1.92x | +1.46% |
| Books & Music | 1.65x | +2.81% |
| Pets & Animals | 1.58x | +7.07% |
| Beauty | 1.57x | −1.07% |
| Food & Beverage | 1.56x | +7.17% |
| Health & Wellness | 1.50x | −2.78% |
| Media & Publishing | 1.17x | −2.22% |
| Platform-wide | 1.86x | +1.29% |
A few things worth pulling out:
Beauty and health are harder than the guides admit. Beauty sits at 1.57x and Health & Wellness at 1.50x, both down year over year. Independent corroboration: Varos data puts beauty at 1.57x as well, an exact match from a separate 28-industry dataset (via Superscale). If you run a skincare brand at 2x blended, you're above the median for your category by a wide margin, whatever a generic "3x minimum" article told you.
The verticals growing fastest are the ones starting lowest. Food & Beverage (+7.17%), Pets (+7.07%), and Home & Garden (+7.04%) posted the biggest gains. Beauty, Health, and Media all went backwards. Category momentum matters more than the absolute number when you're setting next quarter's target.
Higher AOV verticals sit higher, but not by much. Automotive leads at 2.54x and apparel runs 2.18x. The spread across the entire table is 1.17x to 2.54x, which is narrower than most benchmark posts imply. If someone quotes you a 4x category median, ask for the sample.
Warning: These are blended medians across campaign types. A prospecting-heavy account will always read lower than a retargeting-heavy one, so compare like with like. Also note that iOS opt-outs mean Meta under-credits some conversions. Published estimates of the size of that gap range from 15% to 60% and none comes from a controlled study, so treat it as a reason to measure your own gap rather than a number to apply.
Calculate Your Breakeven ROAS
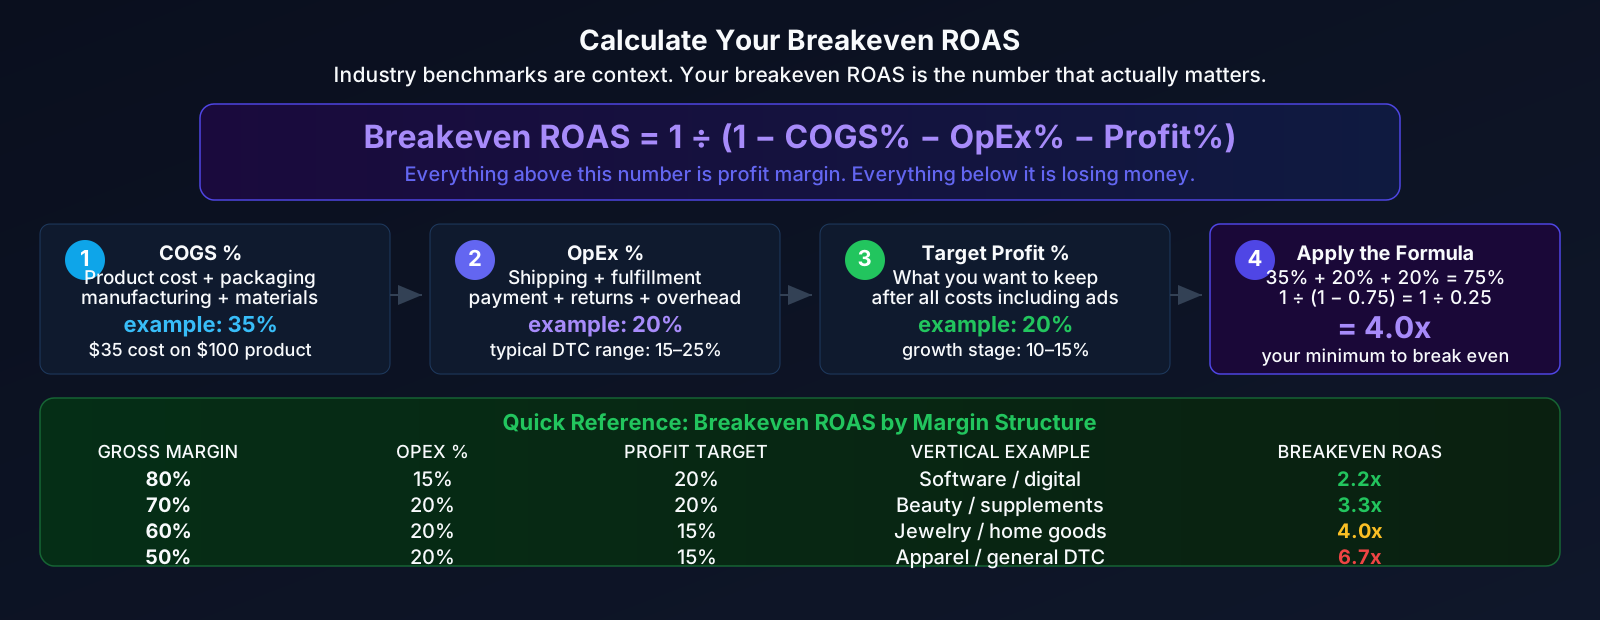
Industry medians tell you where you sit relative to other brands. Your breakeven ROAS tells you whether the campaign makes money. That second number is the one that should drive the scale-or-cut decision, so it comes before the rest of the benchmarks on this page.
Determine Your COGS Percentage
What percentage of revenue goes to product cost? If you sell a product for $100 and it costs $35 to make and package, your COGS is 35%. Include raw materials, manufacturing, and packaging.
Add Operating Expenses as % of Revenue
Fulfillment, shipping, payment processing, returns, customer service, and overhead. For most ecommerce brands this runs 15–25% of revenue. Use 20% if you're not sure of your exact number.
Set Your Target Profit Margin
How much do you want to keep after all costs including ads? For growth-stage brands, 10–15% is realistic. Established brands with proven channels target 20–30%.
Apply the Breakeven Formula
Breakeven ROAS = 1 ÷ (1 − COGS% − OpEx% − Profit%)
Example: 35% COGS + 20% OpEx + 20% target profit = 75% of revenue accounted for. That leaves 25% for ad spend.
Breakeven ROAS = 1 ÷ 0.25 = 4.0x
You need at least 4.0x ROAS to hit your 20% profit margin with this cost structure. Aim for 4.5x+ to build in a buffer for slow weeks and seasonal swings.
Quick Reference: Breakeven ROAS by Margin Structure
| Gross Margin | OpEx % | Profit Target | Breakeven ROAS |
|---|---|---|---|
| 80% (software, digital) | 15% | 20% | 2.2x |
| 70% (beauty, supplements) | 20% | 20% | 3.3x |
| 60% (jewelry, home goods) | 20% | 15% | 4.0x |
| 50% (apparel, general DTC) | 20% | 15% | 6.7x |
| 40% (electronics, food) | 20% | 10% | 10.0x |
Read that table against the industry medians above and an uncomfortable thing shows up: a 50%-margin apparel brand needs 6.7x to hit a 15% profit target, while the apparel median is 2.18x. Most DTC brands fund their target margin from repeat purchases, email, and organic rather than from paid social alone. If your breakeven sits above 6x, cold-traffic Facebook ads will not carry the business on their own, and the fix is margin, AOV, or LTV rather than a better bid strategy.
Run your own margin structure first
Benchmarks are context. Your MER and breakeven are the numbers that decide whether a campaign lives. Our free calculator does the blended math across your whole account in about a minute, no login.
Open the MER CalculatorROAS by Campaign Type
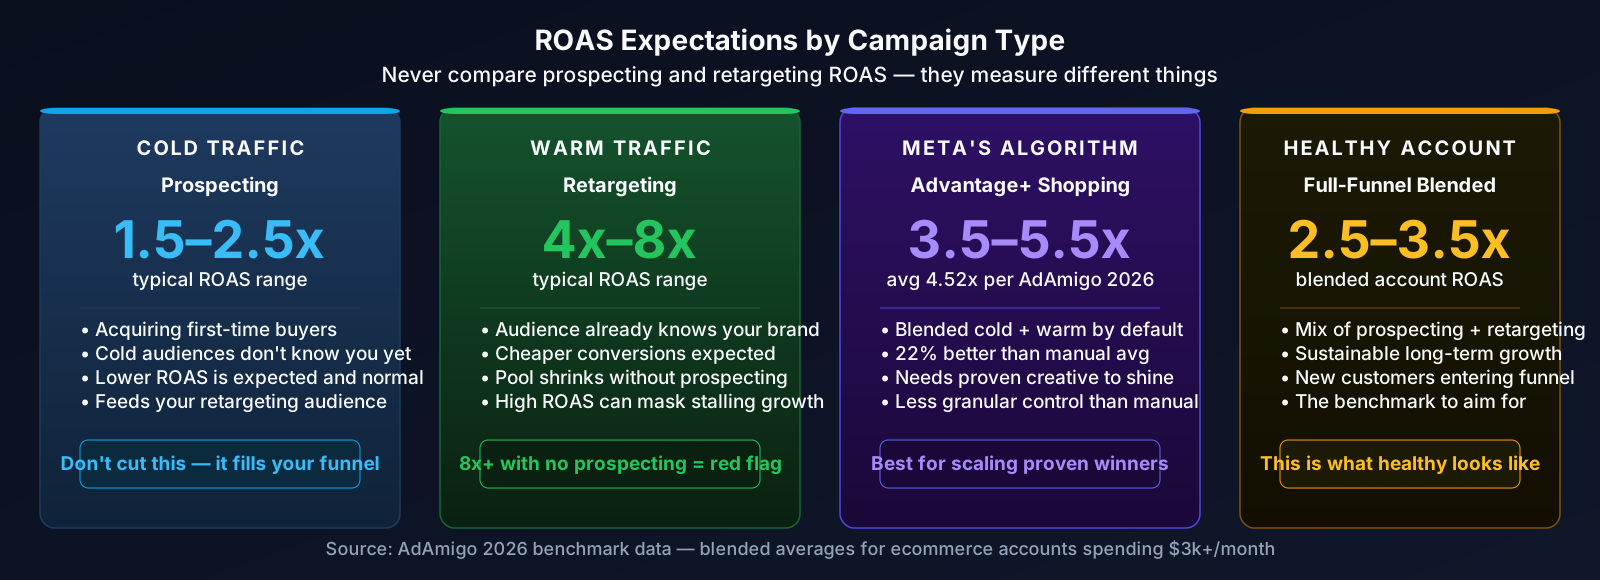
Never judge prospecting and retargeting by the same ROAS standard. Brands average their whole account, see 2.5x, and panic, while their prospecting campaigns are performing exactly as the category does.
Medians and observed ranges across 5,000+ companies (Focus Digital, April 2025):
| Targeting Strategy | Median ROAS | Observed range |
|---|---|---|
| Retargeting (warm) | 3.61x | 1.73x – 7.52x |
| Prospecting (cold) | 2.11x | 1.14x – 4.07x |
| Lookalike | 1.80x | 0.78x – 4.74x |
Retargeting runs 71% above prospecting, not 3x above it. This is the correction most worth absorbing. The widely repeated "retargeting should hit 4x to 8x" range describes the top half of the observed distribution, not the median. A retargeting campaign at 3.6x is performing at category par, and one at 5x sits in the top quarter of the observed range.
Lookalikes landing below cold prospecting will surprise some readers. The range is enormous (0.78x to 4.74x), which fits the operator experience: a lookalike built off a high-value seed segment behaves nothing like one built off all purchasers.
If your prospecting sits at 2.1x and your retargeting at 3.6x, your account is at the median on both. Cutting prospecting because its number looks low shrinks the retargeting pool that produces the higher number, and the effect shows up six weeks later.
For a detailed look at structuring campaigns across the funnel, check our full-funnel Facebook ads strategy guide.
Warning: An account running only retargeting at the top of that range is stalling. You're converting people who already know you without bringing new ones in. That number will shrink as warm audiences dry up. Prospecting and retargeting work together.
ROAS by Product Price Point
Your AOV (average order value) changes what "good" ROAS looks like. Lower-priced products need higher ROAS to cover acquisition costs as a percentage of revenue. Higher-priced products can sustain lower ROAS and still be profitable.
| Price Range | Typical ROAS Needed | Why |
|---|---|---|
| Under $50 | 4.0x+ | Ad costs eat a larger share of each sale. Tight margins demand high efficiency. |
| $50–$150 | 2.5x–3.5x | Sweet spot for most DTC brands. Enough margin to absorb acquisition cost. |
| $150–$500 | 2.0x–3.0x | Higher revenue per sale means ad cost is a smaller slice of the pie. |
| $500+ | 1.5x–2.5x | Even modest ROAS can mean strong profit per order. |
A luxury furniture brand at 1.8x ROAS on a $800 AOV might be clearing $200+ profit per order after ad costs. A $25 accessories brand at 3.0x ROAS might be netting $5. The ROAS number means nothing without the unit economics behind it.
Advantage+ Shopping vs Manual Campaigns
Advantage+ Shopping Campaigns (ASC) outperform manual setups, and this is one of the few headline figures in this post that held up under checking.
AdAmigo reports Advantage+ Shopping at 4.52x ROAS against 3.70x for manual campaigns, a 22% lift. InsightIQ independently puts the ASC advantage at 15% to 25%, which brackets the same result from a separate dataset.
| Campaign Type | Reported ROAS | Best For |
|---|---|---|
| Advantage+ Shopping | 4.52x | Established catalogs, proven creative, scaling spend |
| Manual Campaigns | 3.70x | Granular control, creative testing, niche audiences |
Both figures sit well above the 1.86x platform median, which is a clue about who reports ASC numbers: accounts running ASC at scale tend to be larger, with established catalogs and creative libraries. Read the 22% relative lift as the reliable part and the absolute figures as belonging to that population.
Why ASC outperforms. Meta's algorithm gets more signals and more flexibility with Advantage+ campaigns. It can test audience segments, placements, and creative combinations faster than any human media buyer. The trade-off is control, you're handing optimization decisions to the machine.
When manual still wins. If you're testing new creative angles, launching a new product, or targeting a narrow niche audience, manual campaigns give you the visibility to learn what's working. We run both in most accounts: ASC for proven winners, manual for testing and discovery.
Advantage+ Shopping performs best when you give it a large library of proven creative assets. Test creative in manual campaigns first, identify winners, then feed those into Advantage+ to scale. Dumping untested ads into ASC hands the algorithm a weak deck to play from.
The Video & Reels Effect on ROAS
Video and Reels now account for over 40% of all Facebook and Instagram ad impressions (InsightIQ), and that share is growing every quarter. This shift is reshaping ROAS benchmarks in two ways.
Reels CPMs are still cheaper. Feed CPMs run $10–$16 while Reels sit at $4–$8 (see our cost benchmarks breakdown for detailed placement data). Lower CPMs mean your ad spend goes further when conversion rates hold steady.
Creative volume separates the top quartile. Across 1,247 Meta accounts, top-quartile advertisers run 4.4x ROAS against a 2.9x average, and the operational difference is throughput: brands testing 21 or more creatives per month outperform those testing fewer than 10 (MHI Media data, reported by AdAmigo). The top decile reaches 6.0x. Their CTR runs 4.38% against 2.22% at the average, so the gap opens at the creative, before the landing page ever loads.
Here's what's working on Reels right now:
- First 3 seconds decide whether someone watches or scrolls past. Lead with a hook, not your logo.
- Native-feeling content that matches organic Reels performs best. If it looks like an ad, people skip it.
- Purpose-built vertical video beats resized feed assets. Static-to-video conversions read as repurposed, and delivery costs reflect it.
Ecommerce CPMs rose 20% year over year, from $11.82 to $14.19 (Triple Whale). Auction prices are set by the market. The lever you own is how many concepts you put into the auction, and at 21+ creatives a month that becomes a production question before it's a media one. Briefing and screening that volume is what the Meta Ads Agent does for agencies working a client roster.
When "Low" ROAS Is Actually Fine
Not every campaign needs to hit your target ROAS to be valuable. Here are five situations where below-benchmark ROAS is perfectly acceptable:
You're in a testing phase. New creative, new audiences, new offers, all require a learning investment. ROAS of 1.5–2.0x during testing is normal and expected. The goal is data, not profit. Cut tests that show zero promise, but give promising ones room to optimize.
You're a new brand building awareness. First-time buyers cost more to acquire. Early ROAS of 1.5–2.5x is typical for brands under 6 months old on the platform. You're buying pixel training and market data as much as you're buying sales.
You sell high-LTV products. Subscriptions, consumables, and replenishment products mean a customer's first purchase is just the beginning. A 2x first-purchase ROAS can turn into 6–8x over 12 months if your retention is strong. Optimize for LTV, not first-touch ROAS.
You're expanding into new markets. New geographies, new demographics, or new product categories all reset the algorithm's learning. Expect lower ROAS for 2–4 weeks while the system calibrates to new audience signals.
Top-of-funnel is feeding your retargeting pipeline. Awareness and reach campaigns at 1.0–1.5x ROAS are fine if they're filling your retargeting pool with qualified visitors. The value shows up in your retargeting campaigns, not in the awareness campaign itself.
When "Good" ROAS Is Hiding a Problem
High ROAS isn't automatically good. This is where teams get lulled into bad decisions: the dashboard looks healthy, but the business is not actually growing. Watch for these red flags:
Retargeting-only at the top of the range. If your only campaigns are retargeting, a 7x ROAS is flattering but unsustainable. Your audience pool is finite. Without prospecting to refill it, performance decays month over month until you're retargeting the same 500 people repeatedly.
Tiny budget with inflated ROAS. A $500/month campaign at 6x ROAS is noise. Small sample sizes create high variance, and increasing budget almost always brings ROAS down to more realistic levels. Test whether your performance holds at 2–3x the current spend before making plans around it.
Short attribution window. If you're measuring on 1-day click only, you're missing conversions that happen over the next 6 days. Your ROAS might look lower than reality, or you've accidentally over-optimized for impulse buyers and missed higher-value customers who research before purchasing.
Wrong revenue math. If your ROAS calculation includes gross revenue but ignores refunds, returns, and discounts, you're overstating performance. A beauty brand with 15% return rates needs to calculate ROAS on net revenue for an accurate picture.
Your ads aren't converting new customers. If your ads aren't converting cold traffic and the only revenue comes from warm audiences, the ROAS number is misleading. You're not growing, you're harvesting.
A campaign at 3.5x ROAS generating $8,000 in monthly profit beats a campaign at 6x ROAS generating $1,200 in profit. When scaling, maximize total profit dollars, not the ROAS ratio. Your bank account doesn't care about percentages.
How to Improve Your ROAS
If your ROAS is consistently below your breakeven threshold, here's where to focus, in order of typical impact:
1. Fix Your Creative
Per the tier data above, creative is where the top quartile separates from the median. If your ROAS is declining, stale creative is the most likely culprit. Watch for signs of creative fatigue, frequency climbing above 3, CTR dropping week over week, and CPAs rising on the same audiences.
What to do: Test new hooks, new formats (especially Reels), and different angles. Change the message, not the background color. Study what competitors are running for creative concepts you haven't tried yet.
2. Optimize Your Audiences
Broad targeting works well in 2026, but "broad" doesn't mean "no strategy." Exclude past purchasers from prospecting campaigns. Given that lookalikes median 1.80x, below cold prospecting, build them off your highest-value customer seed rather than all purchasers. Reverse-engineer competitor targeting to find audience segments you've overlooked.
3. Improve Your Landing Page
Your conversion rate is the multiplier that turns clicks into revenue. A landing page converting at 3% versus 1.5% doubles your effective ROAS without changing a single ad, and the tier data puts CVR at 3.2% for the top quartile against 2.1% at the average. Page speed, mobile optimization, clear CTAs, and social proof are the fundamentals. Most brands underinvest here.
4. Test Your Offers
Free shipping thresholds, bundle pricing, limited-time discounts, gift-with-purchase. Test systematically and measure incrementally rather than overhauling everything at once.
5. Increase AOV
Upsells, cross-sells, quantity discounts, and free-shipping thresholds all boost revenue per order without increasing ad cost. A $10 AOV increase on a $60 average order improves your effective ROAS by roughly 17%.
6. Fix Attribution
If you haven't addressed iOS attribution gaps, Meta is under-crediting some of your conversions. Implement server-side tracking (Conversions API), set up UTM tagging, and compare Meta's reported conversions against your own backend over a fixed window. Measure your own gap before applying anyone's published estimate.
ROAS Benchmarks at a Glance
| Dimension | Median | Observed high | When to Investigate |
|---|---|---|---|
| Platform-wide ecommerce | 1.86x | see tier table | Under 1.2x, below every vertical median |
| Prospecting (cold) | 2.11x | 4.07x | Under 1.14x for 2+ weeks |
| Retargeting (warm) | 3.61x | 7.52x | Under 1.73x |
| Lookalike | 1.80x | 4.74x | Under 0.78x |
| Advantage+ Shopping | 4.52x | n/a | Under 3.70x (manual par) |
| Low AOV (< $50) | 4.0x+ needed | n/a | Below your breakeven calculation |
| Mid AOV ($50–$200) | 2.5x–3.5x needed | n/a | Below your breakeven calculation |
| High AOV ($200+) | 1.5x–2.5x needed | n/a | Below your breakeven calculation |
Those rows come from three different datasets: the platform median from Triple Whale, the targeting rows from Focus Digital, Advantage+ from AdAmigo. Read down a column, not across the table.
Performance tiers across 1,247 Meta accounts (MHI Media), for anyone who wants the full distribution:
| Tier | CPM | CPC | CTR | CVR | ROAS |
|---|---|---|---|---|---|
| Average | $14.20 | $0.64 | 2.22% | 2.1% | 2.9x |
| Top 25% | $10.60 | $0.45 | 3.16% | 3.2% | 4.4x |
| Top 10% | $8.30 | $0.32 | 4.38% | 4.6% | 6.0x |
Your breakeven ROAS from the calculator above should always override these generic ranges. A brand with 80% margins might be profitable at 1.5x. A brand with 40% margins might need 5x+. Your cost structure beats benchmarks every time.
Want to see what's driving ROAS in your category?
Browse a finished competitor report on a real brand: the scorecard, top creatives, offers in market, and hook themes worth testing. Pulled from the public Ad Library, so no private spend or ROAS, just what's running. Free, no login.
See Sample ReportsWhat Changed in This Update
This post previously published higher benchmark figures. Updated 4 August 2026 after re-checking every cited source:
- The industry table was rebuilt on Triple Whale's ~35,000-brand full-year 2025 dataset and relabelled 2025. Several verticals moved down substantially. Beauty, for example, was published at 2.8x–3.6x and the source data says 1.57x.
- The headline median moved from 2.79x to 1.86x, switching the anchor from an undisclosed sample to the largest disclosed one.
- Retargeting was corrected from 4x–8x to a 3.61x median, with the full observed range shown.
- Two claims were removed for lack of a verifiable source: a "creative quality drives 50–70% of performance" figure, and a Reels performance number attributed to our own accounts.
- CPM growth was corrected from ~8% to 20%, matching the larger dataset and our own CPA benchmarks.
What to Do With Your Own Number
-
The platform-wide Meta median is 1.86x across ~35,000 ecommerce brands in 2025. If you've been holding yourself to 3x, you've been benchmarking against a figure nobody has substantiated with a sample size.
-
Check the sample before you accept a benchmark. Every source in this post reporting above 2.5x declines to say how many accounts it measured. That test costs you ten seconds and it applies well beyond this page.
-
Your vertical matters more than the platform median. Beauty at 1.57x and Automotive at 2.54x are the same platform 62% apart.
-
Calculate your breakeven ROAS with 1 ÷ (1 − COGS% − OpEx% − Profit%). It is the only number here derived from your business rather than someone else's sample.
-
Retargeting runs 71% above prospecting, not triple. Prospecting at 2.1x and retargeting at 3.6x is a healthy account, not a broken one.
-
Creative throughput is the top-quartile lever. 21+ creatives a month, and a CTR gap of 4.38% against 2.22%, is where the 4.4x accounts separate from the 2.9x ones.
-
Optimize for total profit dollars, not ROAS in isolation. A lower-ROAS campaign generating more absolute profit is a better campaign than a high-ROAS campaign on a tiny budget.
Sources
Listed with sample sizes, because that turned out to be the point.
- Triple Whale: Facebook Ad Benchmarks by Industry. ~35,000 ecommerce brands, 1 January to 31 December 2025. Platform median, vertical table, YoY movement, CPM and CPC.
- Focus Digital: Facebook Ads Average ROAS 2025 Report. 5,000+ companies, April 2025. Targeting-strategy medians and ranges.
- MHI Media, reported by AdAmigo: Fashion Ecommerce Meta Ads ROAS Benchmarks. 1,247 Meta accounts. Performance tiers and creative-volume threshold.
- AdAmigo: Meta Ads ROAS Benchmarks by Industry. Sample not published. Advantage+ versus manual comparison.
- InsightIQ: 2026 E-Commerce Ad Benchmarks. Sample not published. Reels impression share, top-quartile figures, ASC range.
- Varos, via Superscale. 28 industries, April 2025. Used here only to corroborate the beauty vertical.
- DigitalApplied: Facebook Ads Benchmarks 2026. Sample not published. Cited only as the high end of the published spread.
Benchmark medians describe populations, not your account. Results vary with creative quality, targeting, landing page experience, offer strength, attribution setup, and competition in your niche.